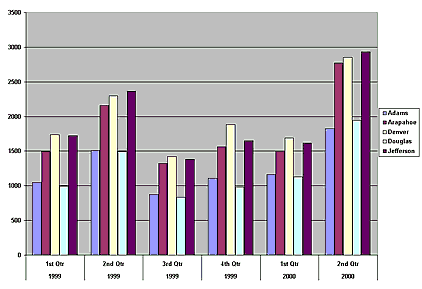
| Menu |  | | Long Term Interest Rates Affect 1st Quarter Overall the number of listings sold in the Denver area was down in the second quarter from the same period in 1999. This was probably due to increasing long term interest rates. In the second quarter of 2000, the number of listings sold increased dramatically from the first quarter of 2000 and from the same period in 1999.
|  Number of Listings Sold Number of Listings Sold
Single Family Houses
Adams, Arapahoe, Denver, Douglas,Jefferson Counties
Including: Aurora, Denver, Castle Rock, Englewood, Golden, Lakewood, Littleton, Morrison, Northglenn, Parker, Thorton, Westminster and Wheat Ridge
| | | 1999
1st Qtr | 1999
2nd Qtr | 1999
3rd Qtr | 1999
4th Qtr | | 2000
1st Qtr | 2000
2nd Qtr | | Adams | 1051 | 1507 | 878 | 1111 | | 1163 | 1825 | | Arapahoe | 1499 | 2158 | 1322 | 1565 | | 1500 | 2769 | | Denver | 1736 | 2300 | 1420 | 1882 | | 1693 | 2849 | | Douglas | 992 | 1495 | 834 | 985 | | 1131 | 1946 | | Jefferson | 1721 | 2364 | 1383 | 1649 | | 1618 | 2929 | |  | |
Number of Listings Sold Chart
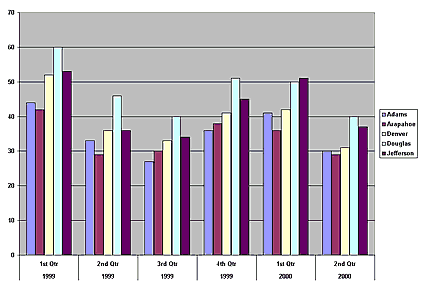
|  |  |  |  |  | The average number of days a home sits on the market is
a very good indicator of the strength of the real estate market. Overall for the first two quarters of 2000, the average number of days a home was on the market declined from the previous year. This indicates a very robust real estate market. | |  Average Number Days on Market Average Number Days on Market
Single Family Houses
Adams, Arapahoe, Denver, Douglas,Jefferson Counties
Including: Aurora, Denver, Castle Rock, Englewood, Golden, Lakewood, Littleton, Morrison, Northglenn, Parker, Thorton, Westminster and Wheat Ridge
| | | | | 1999
1st Qtr | 1999
2nd Qtr | 1999
3rd Qtr | 1999
4th Qtr | | 2000
1st Qtr | 2000
2nd Qtr | | Adams | 44 | 33 | 27 | 36 | | 41 | 30 | | Arapahoe | 42 | 29 | 30 | 38 | | 36 | 29 | | Denver | 52 | 36 | 33 | 41 | | 42 | 31 | | Douglas | 60 | 46 | 40 | 51 | | 50 | 40 | | Jefferson | 53 | 36 | 34 | 45 | | 51 | 37 | Average Number of Days on Market Chart 
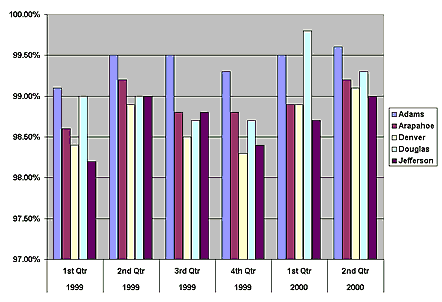
|  |  |  | | The sold versus listing price is also a good indicator of the direction of the real estate market. The first and second quarters of 2000 showed a slight percentage increase over the same periods in 1999 which is also an indicator of upward movement in the market. The table and chart below show the percentage of the sales price to listing price sellers received. | |  Sold vs. Listing Price Sold vs. Listing Price
Single Family Houses
Adams, Arapahoe, Denver, Douglas,Jefferson Counties
Including: Aurora, Denver, Castle Rock, Englewood, Golden, Lakewood, Littleton, Morrison, Northglenn, Parker, Thorton, Westminster and Wheat Ridge
| | | | | 1999
1st Qtr | 1999
2nd Qtr | 1999
3rd Qtr | 1999
4th Qtr | | 2000
1st Qtr | 2000
2nd Qtr | | Adams | 99.1% | 99.5% | 99.5% | 99.3% | | 99.5% | 99.6% | | Arapahoe | 98.6% | 99.2% | 98.8% | 98.8% | | 98.9% | 99.2% | | Denver | 98.4% | 98.9% | 98.5% | 98.3% | | 98.9% | 99.1% | | Douglas | 99.0% | 99.0% | 98.7% | 98.7% | | 99.8% | 99.3% | | Jefferson | 98.2% | 99.0% | 98.8% | 98.4% | | 98.7% | 99.0% | Sold vs. Listing Price Chart 
|  | |